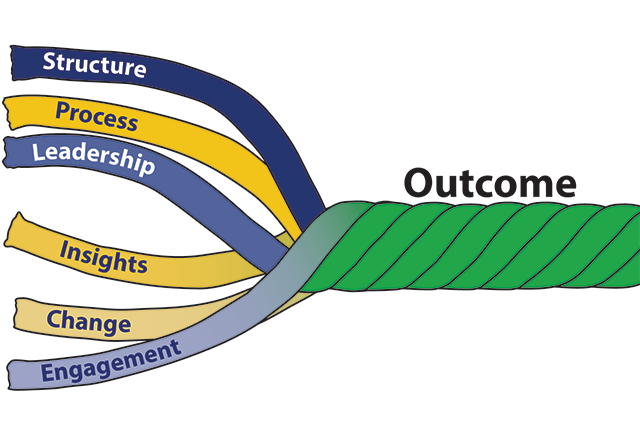
The SPLICE Model
*The outcome metric used in this white paper is Vizient’s Quality & Accountability Study (Q&A) ranking, which has objective metrics in the following domains: mortality, efficiency, effectiveness, safety and patient-centeredness. The data from the Q&A comes from Vizient’s CDB, a database of over 1,200 hospitals that submit monthly patient-level data.
In May of 2023, a Harris poll found that 70% of U.S. adults feel as if the American healthcare system is failing them in at least one way. It continues by saying that patient satisfaction is suffering due to continually rising costs, increasingly challenging access issues, and an unacceptable level of medical errors. These are the same issues outlined in hundreds of polls and articles published over many decades. At the health system level, recent data suggests a lack of improvement in financial, quality, safety and operational metrics (see performance graphs). All of this supports Don Berwick’s comment that the biggest issue in the American healthcare system is our inability to improve.
Yogi Berra once said ‘If you don’t know where you are going, you’ll end up somewhere else’. It is an easy argument to show that we continually end up somewhere else in our current healthcare performance improvement efforts and most times that somewhere else equates to no change. No matter the laudable efforts of many people, we seemed to get derailed in our improvement efforts by everything from bad data to non-engaged leaders and clinicians to lack of accountability. Essentially, we lack the structures and processes that drive improvement - we don’t know where we are going or how to get there.
After 17 years and thousands of presentations to leaders of most of the major health systems in the United States where opportunities in key metrics such as risk-adjusted mortality, risk-adjusted LOS, complications, and cost per patient were presented, SPLICE was developed by Steve Meurer Ph.D., M.B.A., M.H.S. This model outlines the ingredients needed that result in improvement, including structure, process, leadership, insight, change and engagement. As a word, splice is defined as connecting by interweaving strands. Similarly, improvement only results when all ingredients are appropriately included in the right measurements.
Browse each key component:
Structure | Process | Leadership | Insight | Change | Engagement
Structure
The importance of both structure and process in achieving a desired outcome can be traced back to the seminal work of Avedis Donabedian. (Donabedian, A. Explorations in Quality Assessment and Monitoring Vol. 1. The Definition of Quality and Approaches to Its Assessment. Ann Arbor, MI: Health Administration Press, 1980.). To improve any metric, Donabedian’s model suggests that both structure and process are important considerations. In many cases, structure is often discussed but not thoroughly considered. Structure as an ingredient in improvement includes the people and their responsibilities that a health system has focused on improvement. In the last 30 years, these structural components have exponentially expanded. Consider the following examples.
- In one health system, a meeting to discuss how the organization was going to leverage a new comparative database included 6 people with the title of Director or Vice President. Five of the 6 employees reported to someone different in the organization but each saw improvement as a major part of their role. During the meeting, one Vice President said “We all like each other, but we each do not understand when our job begins and ends”. This system of 9 hospitals is consistently ranked around the 50th percentile in the Q&A study*.
- One health system asked for an assessment of the number of people in the quality department of similar-sized systems thinking that they were understaffed. It was found that, while the quality department of that health system did not have as many people, other departments (e.g. Performance Improvement, Analytics, Informatics) had nearly 100 people who considered improvement efforts as a major part of their role. The system began to delineate the roles and responsibilities of all employees with improvement roles, and this resulted in great improvement in the 2022 Q&A study.
The two top systems in Vizient’s Q&A have gone through a thoughtful process to simplify and centralize their improvement efforts. While leaders of each of those systems will say that they have not done enough with structure, they are differentiated from all other systems. These 2 systems have determined the responsibilities of improvement - no matter if it is financial, operational, quality, safety or satisfaction should be under a single department, and the functions should include the development of dashboards, drilling into the dashboards and presenting opportunities, and change management. They have done an inventory within their system of individuals performing these functions and have brought them together under one leader. In total, they have fewer people conducting these efforts but are getting better results. Both systems call their improvement structure the Office of Patient Experience so that it is not confused with improvement in just one area like quality or safety. This structure, however, would not result in improvement if there was not a good process.
Process
There are only two things needed for improvement - data and change. Conceptually, the process of improvement is simple and has been detailed through concepts such as Plan, Do, Study, Act as well as Six Sigma, and Lean. All of these can be described in the more task-oriented steps below.
- Develop ‘balanced dashboards’ with key metrics. Balanced simply means that there are metrics in all key dimensions, which typically include quality, safety, finance, operations and satisfaction.
- Present to pre-determined leaders of each dashboard the performance in the metrics.
- Through data analysis and discussion with key stakeholders, the leaders of each dashboard determine interventions to take to improve the performance of the key metrics.
- Implement and monitor the interventions.
If the process is so simple, why do we not see more improvement? A high number of improvement efforts don’t even get to step 4. Instead, many health systems are mired and enamored with the process of developing metrics and dashboards. Specifically, these systems:
- develop hundreds of non-connected dashboards built by different departments which only serve to cause confusion and a lack of focus on what’s important for success; and
- distribute dashboards to the leaders without context, understanding, or results of further drill down and discussion which then leaves the leaders to guess which interventions need to occur.
The top health systems in the Q&A have one department responsible for developing all metrics and dashboards. They begin with creating a one-page overall balanced dashboard for the executive team (many have adopted Vizient’s Q&A), and then create dashboards by hospitals, departments, service lines, institutes and/or clinical conditions that include the metrics on the executive team's balanced scorecard. These systems are not enamored with all of the BI tools that promise improvement by building the best, most interactive dashboard. Some leading systems even create their dashboards using Excel. The key is to realize that the process of improvement is not dependent on the dashboard but rather on steps 2, 3, and 4.
Step 2 is the most misunderstood in the improvement process. Instead of presenting dashboards to leaders, most health systems simply distribute them monthly. A hospital improved in the Q&A from 48th to 6th place in two years by having analysts build and present dashboards. Six analysts were attached to 4 service lines each. These analysts were responsible for developing the dashboard, presenting it every month to the pre-determined leaders, and then working with the leaders to drive improvement. The leaders relied on these analysts to determine the tailored intervention needed and then to do a lot of the work of change. In the 3 years after their 6th place finish, this hospital was back in the 40’s. Their Chief Quality Officer said the reason was that they made improvement ‘much more complicated’. The IT department had grown substantially and took over the development of dashboards. With a new business intelligence tool, this hospital’s improvement efforts became more about the dashboard than steps 2, 3, and 4.
Leadership
There is no shortage of literature touting the need for CEO attention and interest in achieving results. During the 1,000+ leadership presentations used to develop this white paper, there were 3 scenarios regarding leadership presence: the CEO was present, the CEO was not present but other key senior leaders were, or there were no key senior leaders present. A senior leader is defined as someone who sits at the table for the reoccurring executive meetings.
When there were no senior leaders present, there was a 100% correlation with poor results on the Q&A. At a health system with 2 large academic medical centers (AMC), this scenario played out. At the first AMC presentation, every member of the senior leadership team was present and engaged. This hospital saw the largest improvement in Q&A score over 3 years than any other AMC. We then presented to the other AMC (located about 100 miles away) where we only met with the Director of Quality, the sparse quality team, and 4 physicians. After the presentation, one physician who started with this AMC a year earlier and who came from another AMC commented on how unsophisticated this hospital was in its improvement efforts. This AMC has been in the bottom 20 AMCs in Vizient’s Q&A for the last 3 years.
However, it was not enough for the CEO just to be present. At one health system’s leadership presentation, the CEO sat quietly during the presentation and neither the CEO nor any other leaders had questions. Contrast this with a presentation to a hospital’s leadership team where the CEO stood up, walked around, asked numerous questions, and made several comments (most of which commended his team). The rest of the leadership team was also similarly engaged. The latter hospital moved to the top of the Q&A study for their cohort while the former has been in the bottom third in their cohort.
Many health systems have improved where the CEO was not present at the presentations provided to leadership. These are health systems where the CEO has tapped a senior leader as their key person in the improvement journey, and where the entire health system understands this. This key leader leads the support for improvement in all metrics on the balanced scorecard and not just those for one of the domains. It is important that this key leader report to the CEO.
The main tenet in leadership driving improvement is that they consider their most important role to improve the financial, operational, quality, and safety performance in their organization and that the organization sees this as well. In presentations where the CEO was not present, the capability to improve was directly tied to the comments from the senior leader who was present. If the comments focused on the challenges in that organization to get attention for improvement from the CEO and other key leaders, then improvement did not occur.
Senior leaders must provide more than lip service to this role. As discussed in previous sections, they must develop the structure that drives these improvements. This structure must include a monthly detailed review of a leadership-balanced dashboard and quarterly reviews with service line leaders of their dashboards.
Insight
Insights in healthcare are defined as the specific reasons why one hospital’s performance is different than the other. It is a word that is often used and misinterpreted. Many believe that providing page after page of trend lines showing that a hospital has an opportunity equates to insights. When misinterpreted, it leads organizations to not take action or to implement an intervention that does not improve the metric.
Take a medium-sized hospital that set up a committee to reduce in-hospital sepsis mortality. Rather than complete a detailed data analysis and discussions with key stakeholders to understand why the mortality opportunity existed which would have resulted in tailored interventions, the committee determined during their first meeting that they would focus their efforts on early sepsis recognition. Their rationale was that literature and consultants highly recommended this intervention. Early sepsis recognition is an extremely worthy intervention that improves many patient-focused metrics, but in this hospital, it did not reduce in-hospital risk-adjusted mortality. This hospital was extremely proud of the program they developed but their in-hospital mortality trend did not show improvement.
Take a large AMC’s Chief Quality Officer (CQO) who wanted to understand their mortality opportunity. After data analysis, it was shown that this hospital’s average length of stay (LOS) of patients dying in the hospital was 6 days greater than the average of the other AMCs and that their percent discharge to hospice was 5% lower than the average of other AMCs. When the CQO learned that their mortality opportunity was a LOS issue, she became frustrated saying ‘I’m the CQO and have responsibility for improving mortality, but someone else in the organization who reports elsewhere has responsibility for LOS’. This doesn’t mean that improvement won’t occur. Instead, it means that it will be more difficult because relationships need to be cultivated and negotiation will need to occur.
These examples highlight two very important points around insights. First, the balanced scorecards and associated trend lines tell an organization that they are different. Insights, which can only occur through substantial data analysis, interpretation, and discussions, tell an organization why they are different. Too many organizations believe that newer business intelligence tools produce insights. Rather, it is the interpretation of the output from those tools that leads to additional drill-down and discussion that produce insights. This is typically the role of the analyst. They not only should be able to produce the dashboards and reports, but they also should be able to interpret and discuss them with leaders. For analysts to be able to drive improvement they will need to sharpen 5 characteristics: understanding healthcare, curiosity, problem-solving, understanding variation and storytelling.
Second, it is extremely rare for a health system to have a single improvement effort for all domains on the balanced scorecard. Yet, most of the metrics are related, and the process for improvement of those metrics is the same. This point was alluded to previously when a simplified, centralized structure was highlighted. In healthcare the term ‘quality’ usually equates to only mortality, and ‘safety’ only to complications, and therefore, LOS, readmissions, satisfaction and finance are the purview of other leaders. As previously described, the top 2 systems in Vizient’s Q&A have scrapped the Quality Department and the Chief Quality Officer. Instead, both have built the Office of Patient Experience, which supports improvement in all metrics on the balanced scorecard. The analysts in these departments are expected to understand how healthcare works and be interested in how cost/patient relates to in-hospital mortality so that they can provide their leaders with insights and not just reports.
Change
Near the end of a presentation to leaders of a large AMC, it was mentioned that the opportunities presented this year were the same as those presented in the last two years to the same hospital. After the presentation one of the leaders commented on why there had been no change in the last couple of years. There had always been enthusiasm from the presentations but that waned quickly as the leaders got back into their daily routines of meetings that completely dominated their day.
This example highlights the biggest issue seen with change – namely, that it is discussed excessively but there is little time carved out or resources dedicated to actually making the change. Instead of going through the Plan, Do, Study, Act cycle, the American Healthcare system is stuck on “plan.” Some changes will need meetings and committees, and other changes will need time from two or three people. Even changes planned in a committee structure will need resources and time to make the change.
A small hospital that is part of a large system had a 30-day readmission rate of just over 12%, and this was negatively affecting their finances because of CMS penalties. They invested in multiple programs but were not able to change their performance. The leadership decided to tap an inpatient and outpatient case manager to lead their efforts to reduce 30-day readmissions. They were given data analysis support from the quality department. They were given a year and told they could not spend any more than what was currently in the budget. After a substantial and quick drill-down into their data and bringing together other stakeholders to produce insights, fifteen interventions were developed. Within 6 months of their start date to reduce readmissions, all 15 interventions were implemented. Within a year, their 12% readmission rate was cut in half. One intervention, for example, was the surprise question. During data analysis, it was determined that a higher number than expected deaths occurred in patients within 60 days after their initial admission. A question was placed on the record asking the discharge nurse whether they would be surprised if the patient died in the next 60 days. If the answer was ‘no’, then outpatient palliative care services were triggered.
Another issue we see with change can also be categorized as a structural issue. The American Healthcare system has parceled out the duties of improvement so that one department develops dashboards and another department drives change. These change managers are schooled in lean or project management and have an arsenal of tools (Gantt charts, Stakeholder analysis tables, flowcharts, fishbone diagrams, etc…) to get everyone rowing in the same direction. While very useful for large-scale changes, many improvements need well-respected people who can have productive hallway conversations like the example above. In addition, it is common for the analysts who are building dashboards to want to take a more active role in change management, and the change managers to want to be more active in analytics. This often leads to conflict and little change.
Engagement
It is fitting that the last ingredient is engagement because if a health system has an appropriate structure and process, has leadership focus and gets to insights and change, then engagement should result naturally. A large AMC’s CEO has set up 24 Institutes in their organization and each has a dashboard, and a physician/nurse/administrator leadership team. The CEO meets with each Institute’s leadership team every 6 months where the dashboard is presented. The CEO will then question the leadership team when there is no improvement or change. If the leadership team blames the data or people’s inability to change, the CEO will change out that leadership team with others who can get beyond the data or change issues. While this may seem harsh, it has resulted in high engagement from all clinicians.
Another important ingredient in engagement is getting to insights. For too long in the American Health Care System’s improvement journey the accountability for change and improvement has pointed towards clinicians. As we drill down into the data and have the necessary discussions we find that many of the changes have to do with the structure or with operational metrics like length of stay, which are the purview of leadership. If leadership understands and embodies their role in improvement, then clinicians’ interest and engagement in improvement efforts improves.